If you are managing and monitoring a network you will probably be interested to keep an eye on the latency of your network links. Especially for those links which are connected with a dedicated internet connection and a IPSec VPN tunnel to the datacenter. Latency is predictable but for non private IP VPN links without reserved bandwidth and QoS/CoS it sometimes may help solve some problems or rethink and discuss high latency with the service provider. With dedicated Framerelay/Leased Line/IP VPN network links you can agree with the service provider on the different latency values and have SLA’s in place.
Latency in a packet-switched network is measured either one-way (the time from the source sending a packet to the destination receiving it), or round-trip (the one-way latency from source to destination plus the one-way latency from the destination back to the source). Round-trip latency is more often quoted, because it can be measured from a single point. Note that round trip latency excludes the amount of time that a destination system spends processing the packet. Many software platforms provide a service called ping that can be used to measure round-trip latency. Ping performs no packet processing; it merely sends a response back when it receives a packet (i.e. performs a no-op), thus it is a relatively accurate way of measuring latency.
I am using CactiEZ v0.3 to address this issue and monitor the ping latency. Those hosts may or may not be a SNMP enabled device. If the router is service provider managed than you probably won’t be able to get any access to SNMP, but for this we don’t need it.
a) Create new device in Cacti Management console. See example for www.networknet.nl
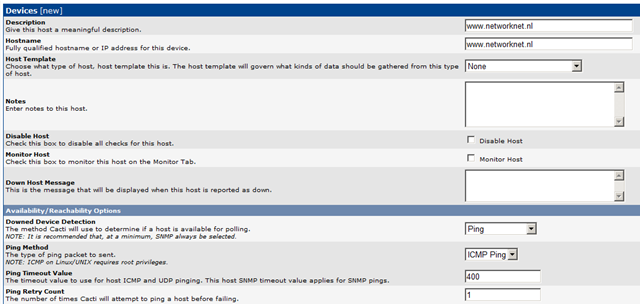
b) Choose for Availability “Ping” and use “ICMP” ping as method. Click Add and reopen the device.
c) Locate Associated Graph Templates and choose “Unix-Ping Latency” in the Graph Templates. Click Add.

d) Click “*Create Graphs for this Host”
e) Select “Create: Unix – Ping Latency” graph template and click Create.
f) Choose Red as legend color and click Create. + Created graph: www.networknet.nl – Ping Latency is now created.
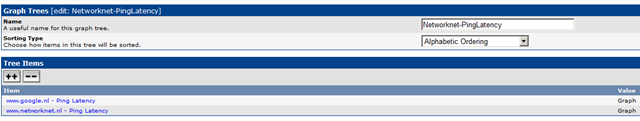
i) Create new Graph Tree and add the new created graph for the network latency. See my example.
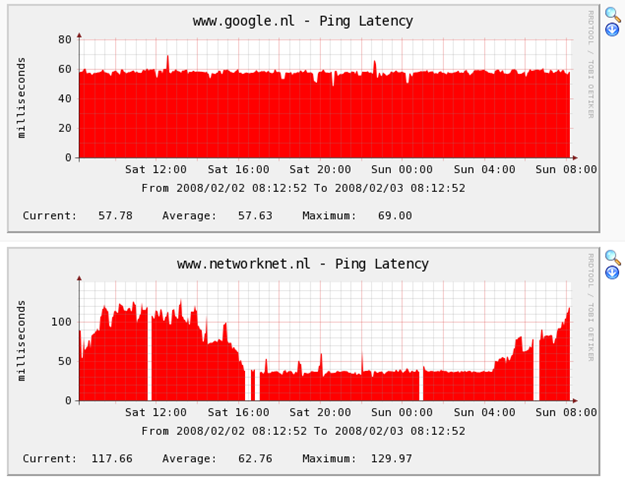
The result:


Hasmezi
i want to monitor smtp server latency. the smtp service is up and running but i cannot ping the server’s IP address. can u pls help me on the configuration to enable me to generate the latency graph for this particular server. i got few others smtp servers that i can generate the latency graph.
Bruno Oliveira
Great guide! Thanks
Mina
It’s not working , graph doesn’t appear !
Ali
GREAT JOB BRO THANKS A MIL
Ali
maybe u can ping the nearest pingable network element to it. One that you are sure is on the same lan, otherwise u need to go with SNMP
Sarmed
I have already generated graphs, but nothing is being plotted. When I go to ‘Device’ I can see that cacti can ping the device. Dunno what’s wrong?
Eli
If your graph isn’t being plotted you may have the same problem I had. Not having ICMP as the ping type for step “b”. I had UDP. Switching it to ICMP got it working.
Sarmed
Well, there was a bug in the cacti ping.pl script….i was doing grep for ‘icmp_seq’ to measure latency whereas my Debian host generates ‘icmp_req’ instead. That’s why I was unable to plot graphs. After tweaking the script, latency graph worked like a charm. 🙂
Olivier
Sarmed,
you re great ! now it works on my Debiantoo
thx
#open(PROCESS, “ping -c 1 $host | grep icmp_seq | grep time |”);
open(PROCESS, “ping -c 1 $host | grep icmp_req | grep time |”);
Matt
Just do this,
open(PROCESS, “ping -c 1 $host | grep ‘icmp_[s|r]eq’ | grep time |”);
kirill
you guys are awsome
theodore_tp
thank you Mr.Ivan.. Its working with Cacti on Freebsd
g3
I’m using CentOS 6.3 but I keep getting the follow error when I run it I get an error:
# open(PROCESS, “ping -c 1 $host | grep ‘icmp_[s|r]eq’ | grep time |”);
bash: syntax error near unexpected token `PROCESS,’
Sarmed
Do a normal ping from your console. Check out whether you get a “icmp_req” or “icmp_seq” in the reply. Modify the perl script accordingly
EITHER
open(PROCESS, “ping -c 1 $host | grep icmp_req | grep time |”);
OR
open(PROCESS, “ping -c 1 $host | grep icmp_seq | grep time |”);
Then run the script manually to check whether you find an error or not.
I don’t mean to do my publicity, but you could check out my blog if you want to.
http://amar-linux.blogspot.com/2012/02/cacti-on-centos-6-setting-up-system.html
g3
Thanks Sarmed.
This is what I get:
64 bytes from ir1.fp.vip.sp2.yahoo.com (72.30.38.140): icmp_seq=2 ttl=250 time=101 ms
64 bytes from ir1.fp.vip.sp2.yahoo.com (72.30.38.140): icmp_seq=3 ttl=250 time=104 ms
[root@pdccentcacti01]# open(PROCESS, “ping -c 1 $host | grep icmp_seq | grep time |”);
bash: syntax error near unexpected token `PROCESS,’
Thanks for the link to your site also.
Sarmed
May I ask how you are running the script? I’m giving a sample run of one of my Debian servers, and the content of the script for your convenience.
The platform is Debian, so only the part “icmp_req” is different from your Red Hat based script. The rest is the same.
############## SAMPLE RUN ##################
root@dragonfly:/usr/share/cacti/site/scripts# perl ping.pl 192.168.1.3
0.655
##########SCRIPT CONTENT############
root@dragonfly:/usr/share/cacti/site/scripts# cat ping.pl
#!/usr/bin/perl
# take care for tcp:hostname or TCP:ip@
$host = $ARGV[0];
$host =~ s/tcp:/$1/gis;
open(PROCESS, “ping -c 1 $host | grep icmp_req | grep time |”);
$ping = ;
close(PROCESS);
$ping =~ m/(.*time=)(.*) (ms|usec)/;
if ($2 == “”) {
print “U”; # avoid cacti errors, but do not fake rrdtool stats
}elsif ($3 eq “usec”) {
print $2/1000; # re-calculate in units of “ms”
}else{
print $2;
}
###############################
g3
I’m in the / directory and I’m running the command from there (I’m very new at this)
I used webmin to file the location of the file (nano /var/lib/cacti/scripts/ping.pl.)
#!/usr/bin/perl
# take care for tcp:hostname or TCP:ip@
$host = $ARGV[0];
$host =~ s/tcp:/$1/gis;
# old linux version use “icmp_seq”
# newer use “icmp_req” instead
open(PROCESS, “ping -c 1 $host | grep ‘icmp_req’ | grep time |”);
$ping = ;
close(PROCESS);
$ping =~ m/(.*time=)(.*) (ms|usec)/;
if ($2 == “”) {
print “U”; # avoid cacti errors, but do not fake rrdtool stats
}elsif ($3 eq “usec”) {
print $2/1000; # re-calculate in units of “ms”
}else{
print $2;
}
Sarmed
from the console, please post the output of the following-
perl /var/lib/cacti/scripts/ping.pl
Sarmed
Correction:
from the console, please post the output of the following-
perl /var/lib/cacti/scripts/ping.pl #### ANY REACHABLE IP ####
g3
[root@pdccentcacti01]# perl /var/lib/cacti/scripts/ping.pl #### ANY REACHABLE IP ####
Usage: ping [-LRUbdfnqrvVaA] [-c count] [-i interval] [-w deadline]
[-p pattern] [-s packetsize] [-t ttl] [-I interface or address]
[-M mtu discovery hint] [-S sndbuf]
[ -T timestamp option ] [ -Q tos ] [hop1 …] destination
U[root@pdccentcacti01 ggraham]#
g3
I copied your script and now it is working. Thanks!!!
Sarmed
good to hear 🙂
In the earlier post, i meant any reachable ip from your network e.g 4.2.2.2 by #### ANY REACHABLE IP ####
but the problem is solved, and that’s what counts. glad I could help.
g3
Sarmed,
What should the output look like after: perl /var/lib/cacti/scripts/ping.pl 192.168.1.1
Sarmed
i should be a number that represents the latency
sleick
Gracias!!!
Ashish Gupta
Hi Team;
Added Window/Linux host without SNMP information @ Cacti but not getting any Latency information on cacti graph
Ashish Gupta
Team;
Added Window/Linux host without SNMP information @ Cacti but not getting any Latency information on cacti graph
Ashish Gupta
sundarkanna
Hi all,
My graph was working to monitor ICMP report. suddenly graph not generating and not working.
please guide anyone that what is template name to make live the same.
Thanks,
sundar
vladimir
Me puedes enviar por favor el template Unix – Ping Latency; lo borre por accidente y no lo encuntro en internet.
Gracias,
khan
my all interface working fine but ping latency is not working .can any boday help on this please .. i have migrate my machine from old to new .please help how ping latency graph will work.
CPG
Thanks for the post. It helped me test my VPN status.
Sara
Thanksssssss
very goooodddddd
Paul Jeyasingh
I have multiple interfaces to my cacti server. And have different subnet IP's to each interfaces. I want to initiate ping to different destinatoin thru different soruce IP's. Is it possible?
For Eg:- eth0 to google.com and eth1 to yahoo.com